
Operations
Manufacturing, supply chain, sourcing, fulfillment, retail distribution and services franchising. The physical side of running a pet business, and where the margin goes.


Start here
- Your Pet Food Supply Chain Is More Fragile Than You Think
Four structurally different failure modes. Operators reliably over-armor one and leave another naked, usually packaging.
- Pet Services Franchise Economics, Compared
The revenue ranking is the inverse of the capital-efficiency ranking. We calculated what each dollar of investment actually buys.
- Why Pet Retail Buyers Say No (And What Changes Their Mind)
Buyers are not evaluating your product. They are betting a fixed shelf, which means velocity evidence beats quality every time.
- What Pet Brands Get Wrong About China Sourcing
Every top-ranking sourcing guide is written by someone who profits from your sourcing decision. What the arbitrage looks like after tariffs and inspection.
Key numbers
- 2.1x
spread in capital efficiency across pet services franchising. Annual revenue bought per dollar invested runs from $0.61 at the bottom to $1.27 at the top, and the ranking inverts the revenue ranking.
- 16%
of pet M&A is a carve-out. Six of the 37 deals we recorded in the first eight months of 2026 separated a plant, a distribution arm or a product line from its parent.
- 9.8M
tons of pet food produced in the US in 2024, drawn from more than 600 ingredients across dozens of countries. The ingredient count, not the tonnage, is the supply chain's real surface area. Source: Pet Food Institute.
- 65%
of pet food manufacturers have delayed, shelved or paused new product development. Capacity, not demand, is the binding constraint on innovation. Source: Petfood Industry.
The first two figures are ours. The capital efficiency spread compares each brand's FDD Item 7 investment midpoint against that same brand's own reported Item 19 revenue, so each is measured only against itself. Filing years differ, so treat the ranking as directional.

Pet Services Franchise Economics, Compared
Pet services franchising is attracting institutional talent and capital, from Petco's former CEO joining Zoom Room to VMG Partners backing Scenthound. This analysis compares the unit economics, growth models, and competitive dynamics operators need to evaluate.
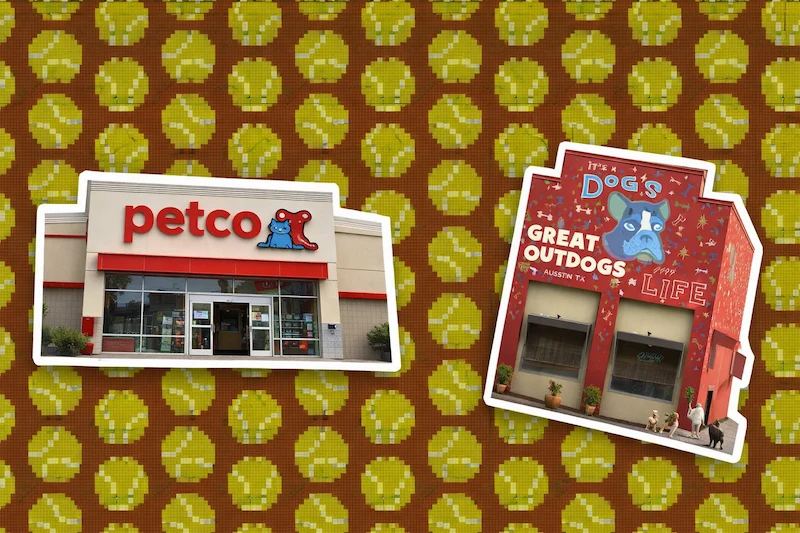
Why Pet Retail Buyers Say No (And What Changes Their Mind)
Most pet brands approach retail the wrong way. They lead with product when buyers lead with numbers. This guide breaks down what Petco, PetSmart, and independent store buyers actually evaluate, the capital requirements nobody mentions, and why proving demand online first has become the new prerequisite for shelf space.
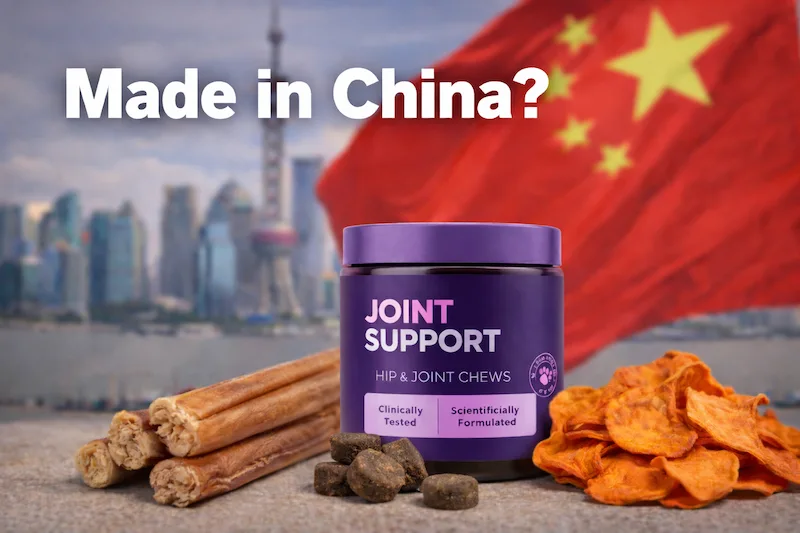
What Pet Brands Get Wrong About China Sourcing
Every guide to China sourcing is written by someone who profits from your decision. This is what sourcing agents leave out: the 29% tariff impact, the trust deficit from the melamine scandal, and why the math doesn't work for everyone.
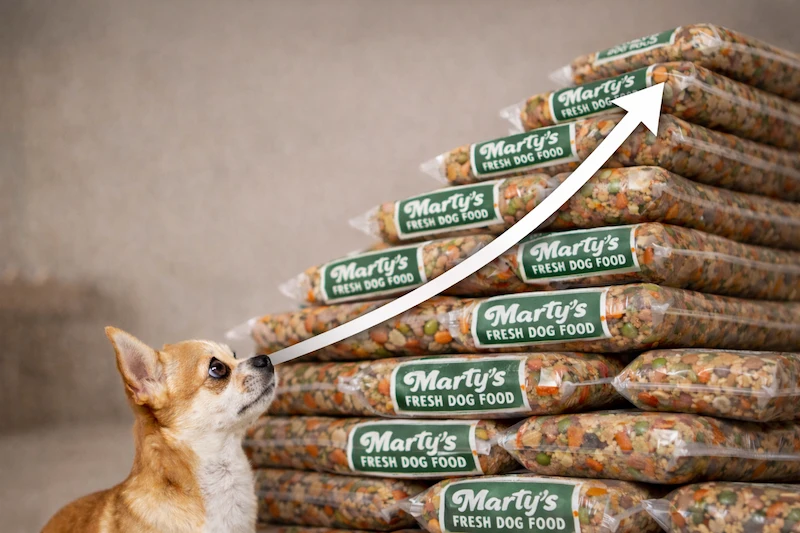
Pet Food Manufacturing: Build, Partner, or Acquire
Every scaling pet brand faces the manufacturing question: stick with co-packers, build your own facility, or acquire existing capacity. This guide provides the decision framework operators actually use, with real costs ($50K-$1M+ for equipment), timelines (months vs. years), and the criteria that determine which path fits your stage.
How Pet Brands Actually Decide Between 3PL and In-House Fulfillment
The 3PL-versus-in-house decision shapes your margins, customer experience, and flexibility for years. This guide breaks down real costs, volume thresholds, and pet-specific requirements like heavy product surcharges and lot tracking to help you make the right call for your stage.
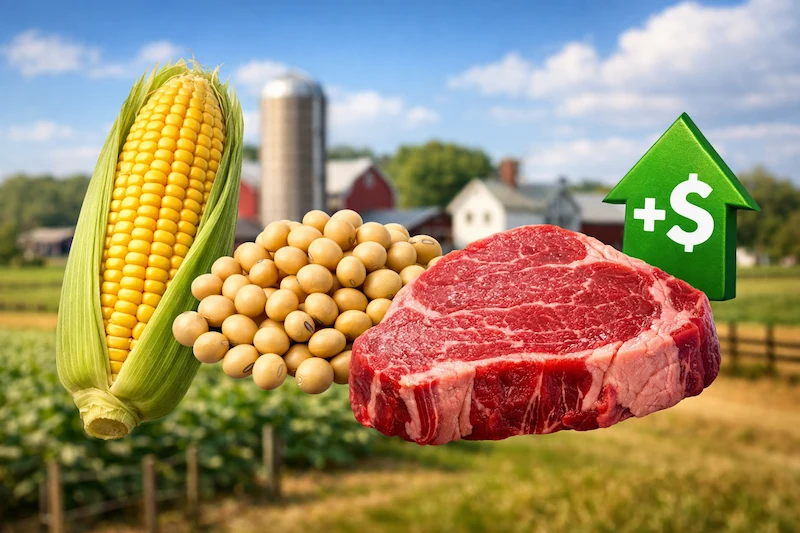
Your Pet Food Supply Chain Is More Fragile Than You Think
The U.S. pet food industry draws from 600+ ingredients across dozens of countries — complexity that becomes liability when something breaks. This guide maps the four failure points in pet food supply chains and the tactical fixes operators use to build resilience without killing margins.